It is my great pleasure to share with you a breakthrough in statistical computing. There are many statistical tests: the t-test, the chi-squared test, the ANOVA, etc. I here present a new test, a test that answers the question researchers are most anxious to figure out, a test of significance, the significance test. While a test like the two sample t-test tests the null hypothesis that the means of two populations are equal the significance test does not tiptoe around the canoe. It jumps right in, paddle in hand, and directly tests whether a result is significant or not.
The significance test has been implemented in R as signif.test and is ready to be sourced and run. While other statistical procedures bombards you with useless information such as parameter estimates and confidence intervals signif.test only reports what truly matters, the one value, the p-vale.

For your convenience signif.test can be called exactly like t.test and will return the same p-value in order to facilitate p-value comparison with already published studies. Let me show you how signif.test works through a couple of examples using a dataset from the
RANDOM.ORG database:
# Sourcing the signif.test function
source("https://www.sumsar.net/files/posts/2014-02-13-a-significantly-improved-test/significance_test.R")

# A one sample signif.test
signif.test(c(7.6, 5.9, 5.2, 4.2, -1))
##   Test of Significance
##
## H0: p will be more than 0.05
## H1: p will be less than 0.05
##
##   Result
## significant (p = 0.0395)
# A two sample signif.test
signif.test(c(-0.7, -4.4, -7.8, 3.8), c(17.9, 22.9, 16.3, 19.1))
##   Test of Significance
##
## H0: p will be more than 0.05
## H1: p will be less than 0.05
##
##   Result
## extremely significant (p < 0.001)
Except for the p-value signif.test also reports a verbal description of the effect size of the p-value, for example:
# An unsuccessful experiment
signif.test(c(12.4, 7.9, 9.7), c(13.9, 7.7, 9.9), paired = TRUE)
##   Test of Significance
##
## H0: p will be more than 0.05
## H1: p will be less than 0.05
##
##   Result
## not significant (n.s.)
# A successful experiment
signif.test(c(58.6, 62.7, 68.5, 58.8, 75.4))
##   Test of Significance
##
## H0: p will be more than 0.05
## H1: p will be less than 0.05
##
##   Result
## significant beyond doubt (p < 0.0001)
An interesting situation, that oh so many researchers have been battling with, is when a result is almost significant. Here signif.test uses
the database compiled by Matthew Hankins to every time give a new example of how such a result could be presented in writing.
signif.test(c(3.9, 8.9, -1.2, 8.9, 2.1))
##   Test of Significance
##
## H0: p will be more than 0.05
## H1: p will be less than 0.05
##
##   Result
## practically significant (p = 0.0831)
signif.test(c(3.9, 8.9, -1.2, 8.9, 2.1))
##   Test of Significance
##
## H0: p will be more than 0.05
## H1: p will be less than 0.05
##
##   Result
## on the very fringes of significance (p = 0.0831)
signif.test(c(3.9, 8.9, -1.2, 8.9, 2.1))
##   Test of Significance
##
## H0: p will be more than 0.05
## H1: p will be less than 0.05
##
##   Result
## fell barely short of significance (p = 0.0831)
Download signif.test from
here or source it directly as above to see many more useful formulations. A current limitation of signif.test is that it compares at most two groups. If your data contains more groups you can compare them two at a time, surely some combination is going give a significant result!
Or perhaps I’m just kidding…
p-values Suck
Sorry for being blunt, but it is true. p-values do not answer the question (dare I say most) people think/hope they do: “Is there a difference?” What is worse, the question most people think p-values answer (but they don’t) is not the right question to ask 95% of the time! In very few situations the interesting question is whether there is a difference, the interesting question is almost always: How large is the difference? What does p-values tell us about magnitudes? Zip!
p-values are visual noise taking up precious journal space that could be filled with useful stuff such as actual estimates, effect sizes, scatter plots, confidence or credible intervals, R-code, AICs and DICs, box plots, yes sometimes even white space would be an improvement. I’m not going to rant more about p-values here, they have already been accurately characterized by others:
- Dance of the p-values, a fun and quick video about some problems with p-values.
-
The Cult of Statistical Significance: How the Standard Error Costs Us Jobs, Justice, and Lives. A book that forcefully criticizes “the sizeless stare of statistical significance” and argues for less p and more oomph in science. The arguments are also available in this shorter article.
-
On John D. Cook’s blog: p-values are inconsistent and Five criticisms of significance testing.
-
Cohen, J. (1994). The earth is round ( p < 05). American psychologist, 49(12), 997. pdf
-
Johnson, D. H. (1999). The insignificance of statistical significance testing. The journal of wildlife management, 763-772. pdf
-
Gigerenzer, G., & Krauss, S. V. O.(2004). The Null Ritual: What you always wanted to know about significance testing but were afraid to ask. The Sage Handbook of Methodology for the Social Sciences, 391-408. pdf
-
Wagenmakers, E. J. (2007). A practical solution to the pervasive problems of p values. Psychonomic bulletin & review, 14(5), 779-804. pdf
-
Kruschke, J. K. (2010). What to believe: Bayesian methods for data analysis. Trends in cognitive sciences, 14(7), 293-300. pdf
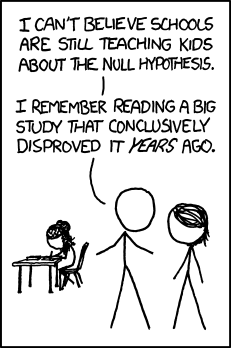
If you just replace “disproved” with “debunked” this xkcd comic would be a pretty accurate description of how I feel about p-values: