I just wanted to plug for three classical books on statistical graphics that I really enjoyed reading. The books are old (that is, older than me) but still relevant and together they give a sense of the development of exploratory graphics in general and the graphics system in R specifically as all three books were written at Bell Labs where the S-language was developed. What follows is not a review but just me highlighting some things that I liked about these books. So, without further ado, here they are:
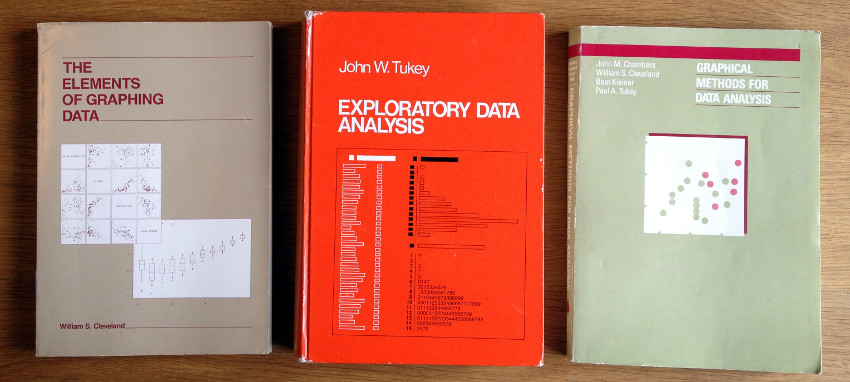
- Exploratory Data Analysis by John W. Tukey (1977)
- Graphical Methods for Data Analysis by John M. Chambers, William S. Cleveland, Beat Kleiner and John W. Tukey (1983)
- The Elements of Graphing Data by William S. Cleveland (1985)
Exploratory Data Analysis (1977)
by John W. Tukey
This is the classic that championed exploratory data analysis (as opposed to confirmatory data analysis) and that introduced box plots to a wider audience. Here is one of the first box plots in the book:
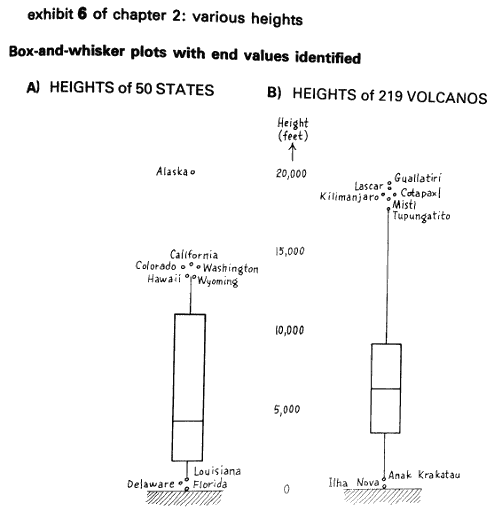
As with all other graphs in the book, it is hand drawn. The content of the book is familiar yet alien. Familiar because of the topic, the analysis of low dimensional data sets, but alien in the approach: The book contains almost no talk about distributions, no talk about probability, no p-values, no least squares, the median is used almost exclusively as the measure of central tendency, every procedure is designed to be done by hand and model assessment is done exclusively visually. The book is also quirky in that Tukey introduces a lot of new terminology (reroughing, cross medians, trimeans, untilting, froots, etc.), even when alternatives exist (hinges instead of quantiles, re-expression instead of transformation). Except for graphical displays, such as box plots and stem-and-leaf plots, the book has a great treatment of residual diagnostics and ways to re-express data to make it easier to see what’s going on. Tukey, for example, introduces the useful flog re-expression of count data that I’ve written about earlier.
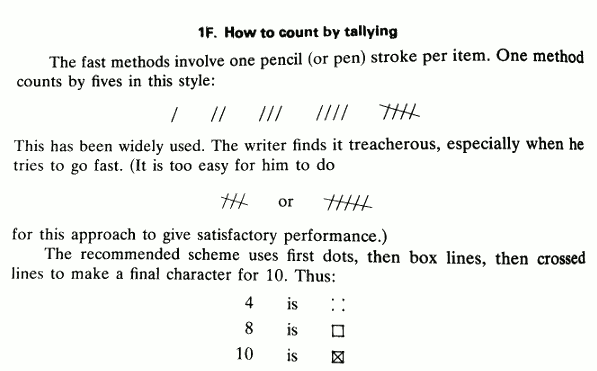
In some way the book is very dated (but charmingly so). A large part of the book is about how to graph and calculate using pen and paper. For example, Tukey gives good advice on how to tally in a less error prone way…
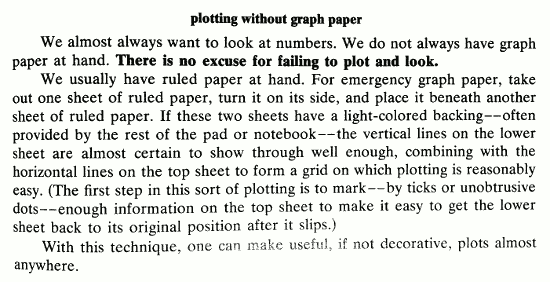
… or what to do when we (gasp!) do not have graph paper at hand:
By the way, if you want to know more (touching everything) about box plots I can recommend the paper 40 years of boxplots (Wickham & Stryjewski, 2012).
Exploratory Data Analysis on Amazon
Graphical Methods for Data Analysis (1983)
by John M. Chambers, William S. Cleveland, Beat Kleiner and John W. Tukey
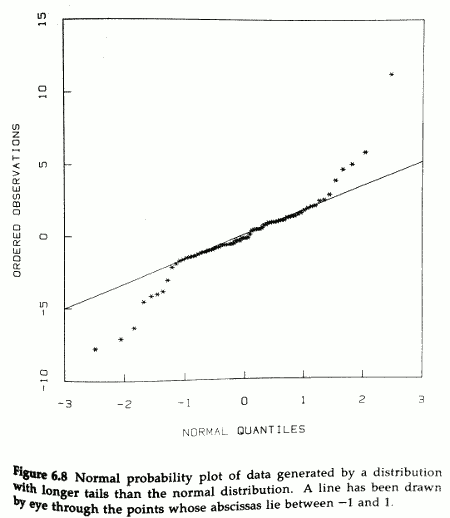
Among the authors of this book we find John M. Chambers of S and R fame, William S. Cleveland of loess and trellis plot fame and John W. Tukey which is generally famous. Wow! This book is much less dated than Exploratory Data Analysis, no more discussions about graph paper as all graphs are made using S (the predecessor of R). The book is a great overview of what is now base graphics in R, with most of the material focused on scatter plots. A large part of the book is also dedicated to the creation and interpretation of quantile-quantile plots with lots of hands on advice and useful tips (I learned a lot).
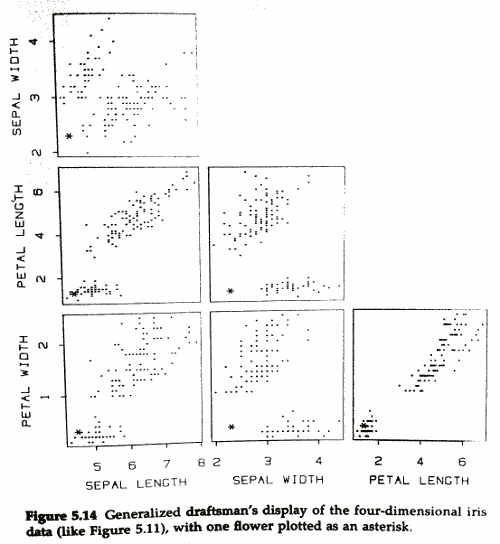
This book also contains the first written description (according to Cleveland, 1985) of scatter plot matrices, here called draftman’s displays.
Graphical Methods for Data Analysis on Amazon
The Elements of Graphing Data (1985)
by William S. Cleveland
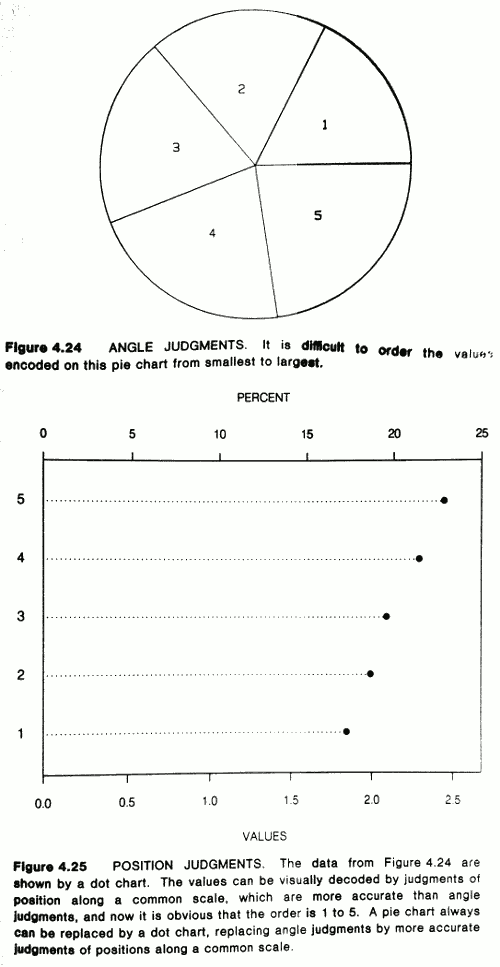
A great book that doesn’t feel dated at all and that reads a little bit like a more practical version of Tufte’s The Visual Display of Quantitative Information. Cleveland describes a large number of different graphs and mixes practical considerations with aesthetic advice. He includes the best material from Tukey (1977) and Chambers (1983) and expands on this. Notably he introduces the dot chart as an alternative to pie charts and bar charts:
The last chapter in the book is on graphical perception where Cleveland discusses what makes a good graph considering our visual perception abilities. Unsurprisingly he does not recommend using pie charts.
Out of the three books this is the one I enjoyed the most.
The Elements of Graphing Data on Amazon