hygge
A Danish word (pronounced HU-guh) meaning social coziness. I.e. the feeling of a good social atmosphere. – Urban Dictionary
Yes, there was plenty of hygge to go around this year’s UseR! that took place last week in Aalborg, Denmark. Everybody I’ve spoken with agrees that it was an extraordinary conference, from the interesting speakers and presentations to the flawless organization (spearheaded by Torben Tvedebrink) and the warm weather. As there were many parallel session, I only managed to attend a fraction of the talks, but here are some of my highlights:
- Romain François, of RCPP and dplyr fame, kicked off the conference with the keynote speech My R adventures which included many cute cat pictures (some might say too many, but don’t listen to them!)
- I’ve never touched spatial statistics and therefore really enjoyed Adrian Baddeley’s keynote speech How R has changed spatial statistics, which, among other things, introduced me to the spatstat package for spatial statistics in R.
- Stefan Milton Bache held the presentation Using R in Production which I almost missed due to the boring title (sorry Stefan! :), however, the presentation was far from boring! Stefan’s presentation focused on how to make R code more reliable and easier for others to read using his packages magrittr, import and ensurer. (A cool thing with Stefan’s presentation was that it consisted entirely of screenshots of code, which might sound a tad boring, but which worked really well!)
- Di Cook held the keynote presentation A Survey of Two Decades of Efforts to Build Interactive Graphics Capacity in R. I haven’t really used interactive graphics that much (except for the very handy manipulate package in RStudio) but I will check out the GGobi package for Interactive and dynamic graphics ASAP.
- Everything RStudio does is awesome, from the recent improvements to the Rstudio IDE (presented on the Friday by president Tareef Kawaf), to their many packages (two new additions being readxl and readr presented on the Wednesday by Hadley Wickham). But you probably already knew this…
- I had the pleasure of meeting Mine Çetinkaya-Rundel who is a great R and stats pedagogue, and one of the people behind the free OpenInto textbooks.
- It’s hard to describe if you weren’t present but Thomas Levine’s presentation on Plotting data as music videos in R made my jaw drop, and I think it is still left in Aalborg. You can find a text version of his presentation here.
Again, this was just a fraction of all the great things that went on at UseR! 2015. Looking forward to UseR! 2016 in Stanford, they have some seriously big Danish shoes to fill. :)
My tutorial and presentation
I was very lucky to be able to contribute both a presentation and a tutorial this UseR, and given the circumstances I believe both went fairly well. (I had planned for ~30 participants at my tutorial, but around 80 showed up!) Below are the slides and material from both my presentation and my tutorial, this is mainly for those that were present as the slides aren’t really self explanatory.
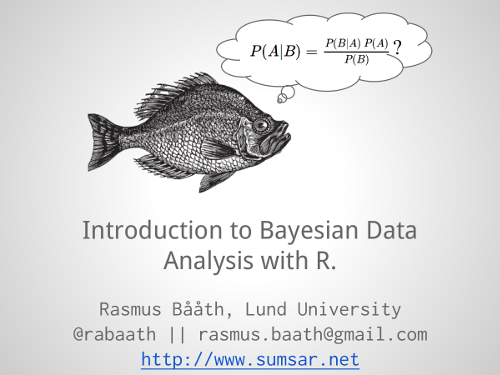
Tutorial: Introduction to Bayesian Data Analysis with R.
This was a three hour tutorial that introduced Bayesian data analysis from scratch using approximate Bayesian computation (which sounds complicated, but is really very intuitive) and the JAGS modeling language.
If you would like me to hold this tutorial (or a shorter version of it) at your organization or university, please contact me at rasmus.baath@gmail.com . I mostly hang out in Sweden and Denmark, but if you can help me with the travel expenses, who knows… :)
The tutorial included some live coding and a number of exercises which can be found here:
- Live coding of the fish capture re-capture model
- Exercise 1: Bayesian A/B testing for Swedish Fish Incorporated (including answers)
- Exercise 2: Bayesian computation with JAGS and farmer Jöns
- Answers to Exercise 2
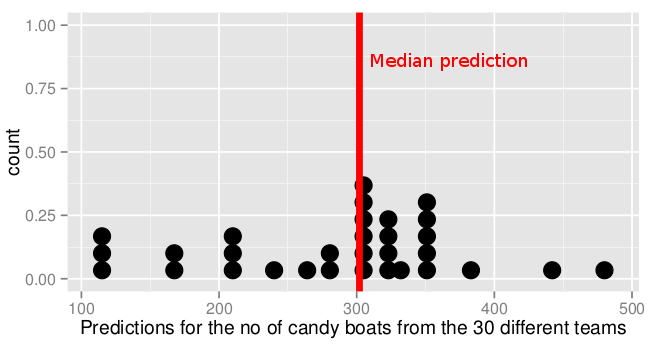
As there wasn’t any prediction contest at UseR! this year, the tutorial also included the (unofficial) official UseR! 2015 prediction competition. A candy jar contained an unknown number of Swedish sweet liquorice boats and the goal was to predict that number. Thirty of the boats had been marked red in advanced and when 30 boats were pulled out of the jar at random, three out of the 30 boats were red. Here are the full instructions. Congrats to teams CanFinDen, ScotAm and Potato Boss for all predicting that there were 300 candy boats (which was closest to the actual number of 294 boats). Here is the distribution of answers from the 30 teams, which is nicely centered around 300 (but much more spread out than I would have anticipated, especially since I assumed everybody would use the same method).

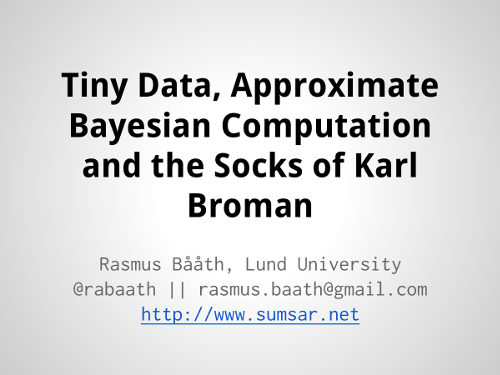
Presentation: Tiny Data, Approximate Bayesian Computation and the Socks of Karl Broman
This presentation was based on
this blog post and, eventually, I plan to produce a screencast of the presentation. Update: This presentation is now available as a 15 minute screencast:
Tiny Data, Approximate Bayesian Computation and the Socks of Karl Broman: The Movie.

