Hello stranger, and welcome! 👋😊
I'm Rasmus Bååth, data scientist, engineering manager, father, husband, tinkerer,
tweaker, coffee brewer, tea steeper, and, occasionally, publisher of stuff I find
interesting down below👇
It’s a special kind of happiness when one can one-shot an app/script. That is, write a single prompt that a capable LLM can use to deliver the whole thing in a single attempt.
For me, the feelings follow this trajectory: smugness that my single prompt actually worked, then a light dusting of shame, because in ye olden days this code would have been artisanally handcrafted by me, and finally happiness, as I got a working piece of code in ~10 minutes, rather than a full weekend.
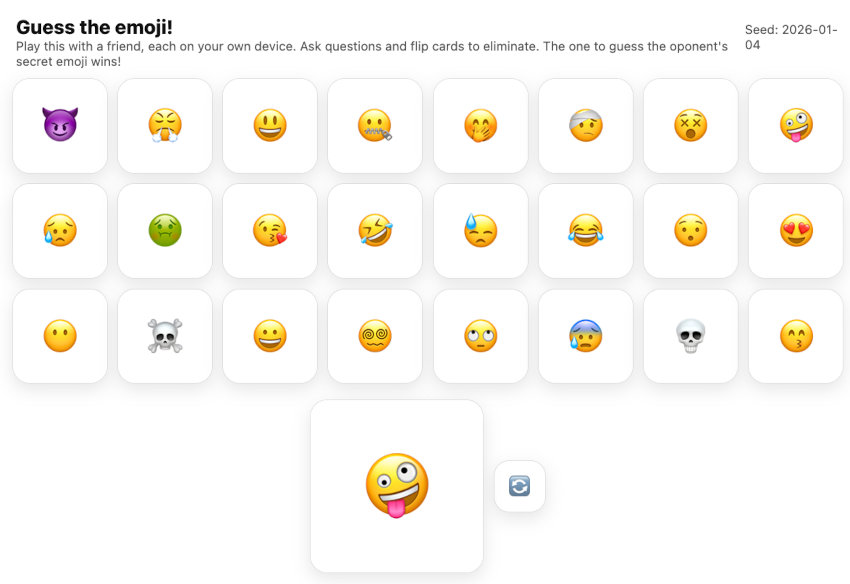
Here’s a one-shot from yesterday that made me fairly happy. I was playing
Guess Who? with my 7-year-old son and started thinking: could this be fun if played with something other than the same old faces, say emojis? Ten minutes later, after some light prompting, it turns out the answer is yes. Try Guess the emoji! here.
I hacked together a simple and friendly retro-styled chatbot UI over the weekend. I wanted to give my kids some experience with LLM chatbots and also some practice typing on a keyboard. But I felt they needed something more engaging than the ChatGPT app. So, after an intense evening hackapromptathon, I ended up with Bötty:

Bötty is a fun, friendly, and simple ChatGPT UI with the following features:
In Sweden, there’s a long tradition of TV and radio advent calendars: shows, often Christmas-themed, that are exactly 24 episodes long. Each of the 24 days in December leading up to Christmas, a new episode drops. Whether this year’s advent calendar shows are better or worse than last year’s is always a hotly debated topic. But, obviously, the best calendar shows were the ones airing when I grew up.
That’s why I was particularly pleased when I won a mint-condition, unopened advent calendar for the 1994 radio show Hertig Hans Slott at an online auction. Instead of keeping this paper calendar unopened, I decided to thoroughly scan it and make it live forever as an online advent calendar. A couple of hours with a friendly AI, and some fidgeting with CSS clip-paths, and I ended up with
a result I was pretty happy with:
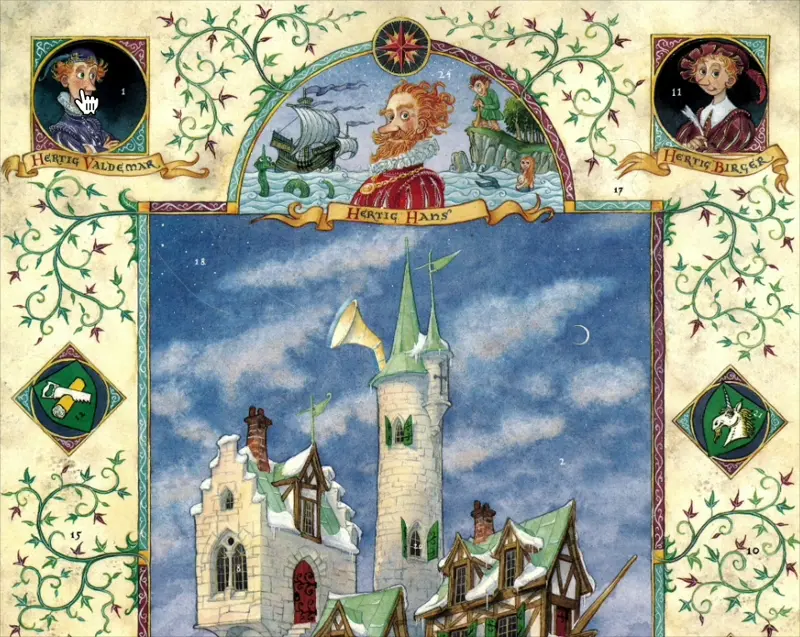
Here are some notes on how it works and an HTML template that you can use to create a Christmas advent calendar yourself.
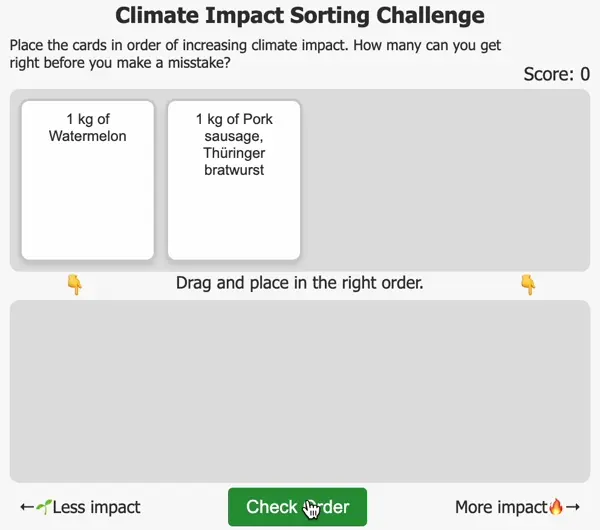
Last week I made the small card sorting game called
The Climate Impact Sorting Challenge where the challenge is to sort cards with different foods in the order of their climate impact. But then the thought hit me: Any time you find yourself with a dataset with labels (say, types of foods) mapped to numbers (say, climate impact in CO2e) you could turn that into a card sorting game! So, I created a template to facilitate this, and in this post, I’ll show you how to make card sorting games like these using R (or really any data-savvy language):
Try out
The Climate Impact Sorting Challenge!
A quick game I just made that teaches you about the climate impact of different kinds of food.
Sometimes it feels a bit silly when a simple statistical model has a
fancy-sounding name. But it also feels good to drop the following in
casual conversation: “Ah, then I recommend a Plackett-Luce model, a
straightforward generalization of the Bradley–Terry model, you know”,
when a friend wonders how they could model their, say, pinball
championship dataset. Incidentally, in this post we’re going to model
the result of the IFPA 18 World Pinball Championship using a
Plackett-Luce model, implemented in Stan as a generalization of the
Bradley–Terry model, you know.
I know neither who Bradley, Terry, Plackett, nor Luce were, but I know
when their models could be useful:
This is just a post to brag about that
the CopenhagenR useR group is alive and kicking, again.
After COVID-19, the group (like so many other meetups) was on hiatus for a couple of years and without an organizer. In 2023, I thought I would try starting it again and, while it took a little while, I’m happy that I got together five great meetups for the spring 2024 season! Here’s a little bit about what went down.
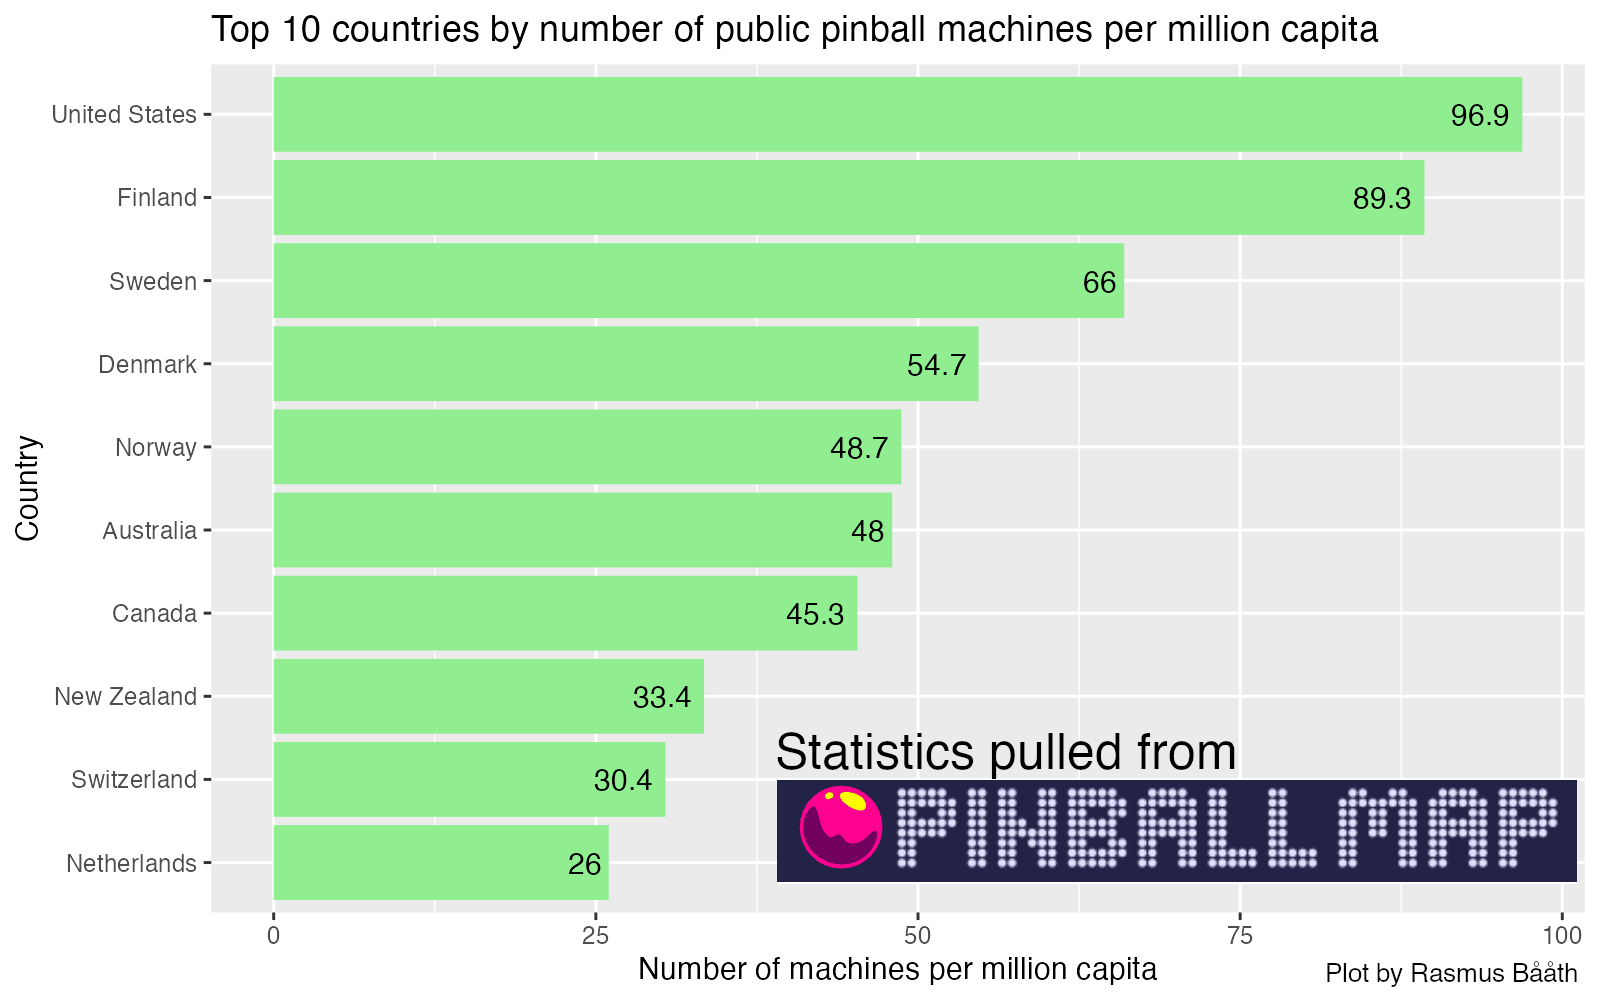
There are tons of well-known global indicators. We’ve all heard of gross
domestic product, life expectancy, rate of literacy, etc. But, ever
since I discovered
pinballmap.com, possibly
the world’s most comprehensive database of public pinball locations,
I’ve been thinking about a potential new global indicator: Public
Pinball Machines per Capita. Thanks to Pinball Map’s
well-documented
public API, this indicator
is now a reality!
 Here’s how this was
put together (and just scroll to the bottom for a CSV file with this
indicator for all countries).
Here’s how this was
put together (and just scroll to the bottom for a CSV file with this
indicator for all countries).
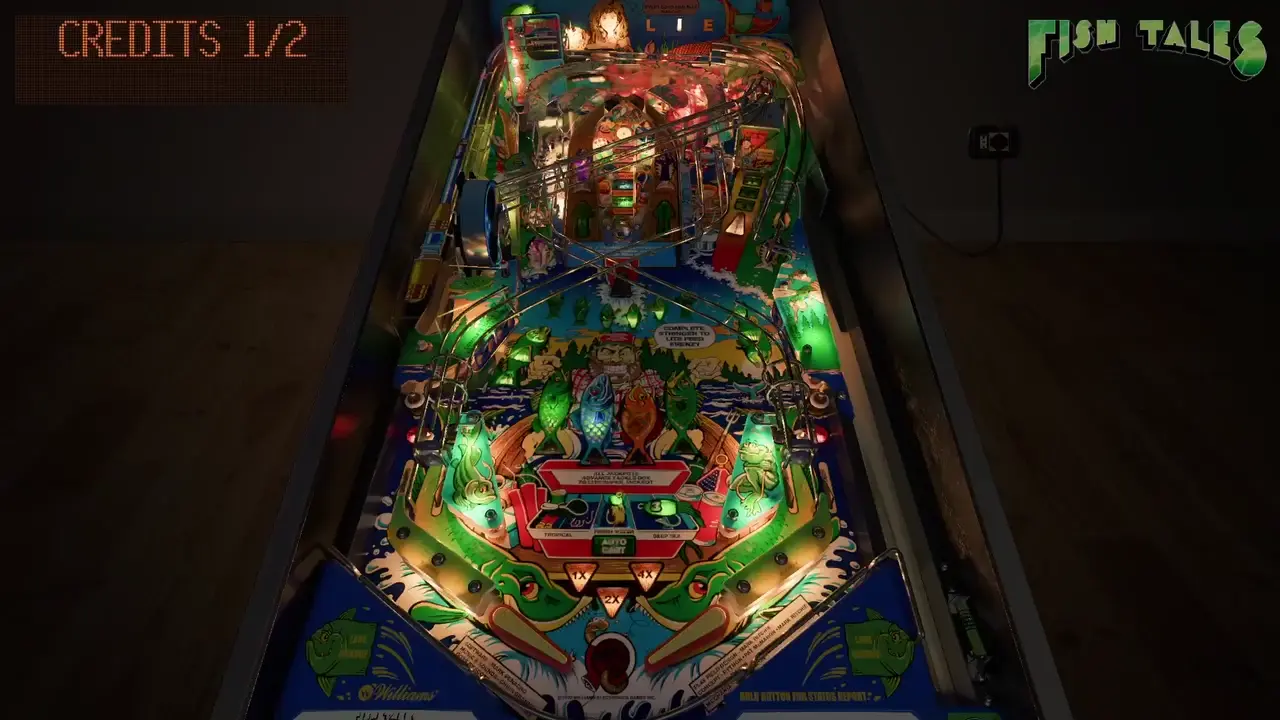
Upon discovering that the tiny town I live in has a pinball arcade with
over 40 tables (!), I got a bout of pinball fever. I fancy myself a
fairly accomplished video game player, but was disappointed to discover
that my ability to keep Mario alive didn’t translate to preventing the
pinball from draining. Assuming I just needed a bit of practice, I
downloaded
a virtual version of Fish
Tales — a fun,
fishing-based table from 1992 — and began practicing. Here’s the data
and quick analysis of how I improved over 100 games of Fish Tales.
(By the way, if you didn’t know, the hobbyist pinball emulation scene is
amazing. Almost every real pinball table from the last 70 years has
been painstakingly 3D-model by someone and is
available completely
for free, but completely not legally…)
Five years ago I started a new role and I suddenly found myself, a
staunch R fan, having to code in Python on a daily basis. Working with
data, most of my Python work involved using
pandas, the Python data frame library,
and initially I found it quite hard and clunky to use, being used to the
silky smooth API of R’s
tidyverse. And
you know what? It still feels hard and clunky, even now, 5 years later!
But, what seems even harder, is explaining to “Python people” what they
are missing out on. From their perspective, pandas is this fantastic
tool that makes Data Science in Python possible. And it is a fantastic
tool, don’t get me wrong, but if you, like me, end up in many “pandas is
great, but…”-type discussions and are lacking clear examples to link to;
here’s a somewhat typical example of a simple analysis, built from the
ground up, that flows nicely in R and the tidyverse but that becomes
clunky and complicated using Python and pandas.
Let’s first step through a short analysis of purchases using R and the
tidyverse. After that we’ll see how the same solution using Python and
pandas compares.