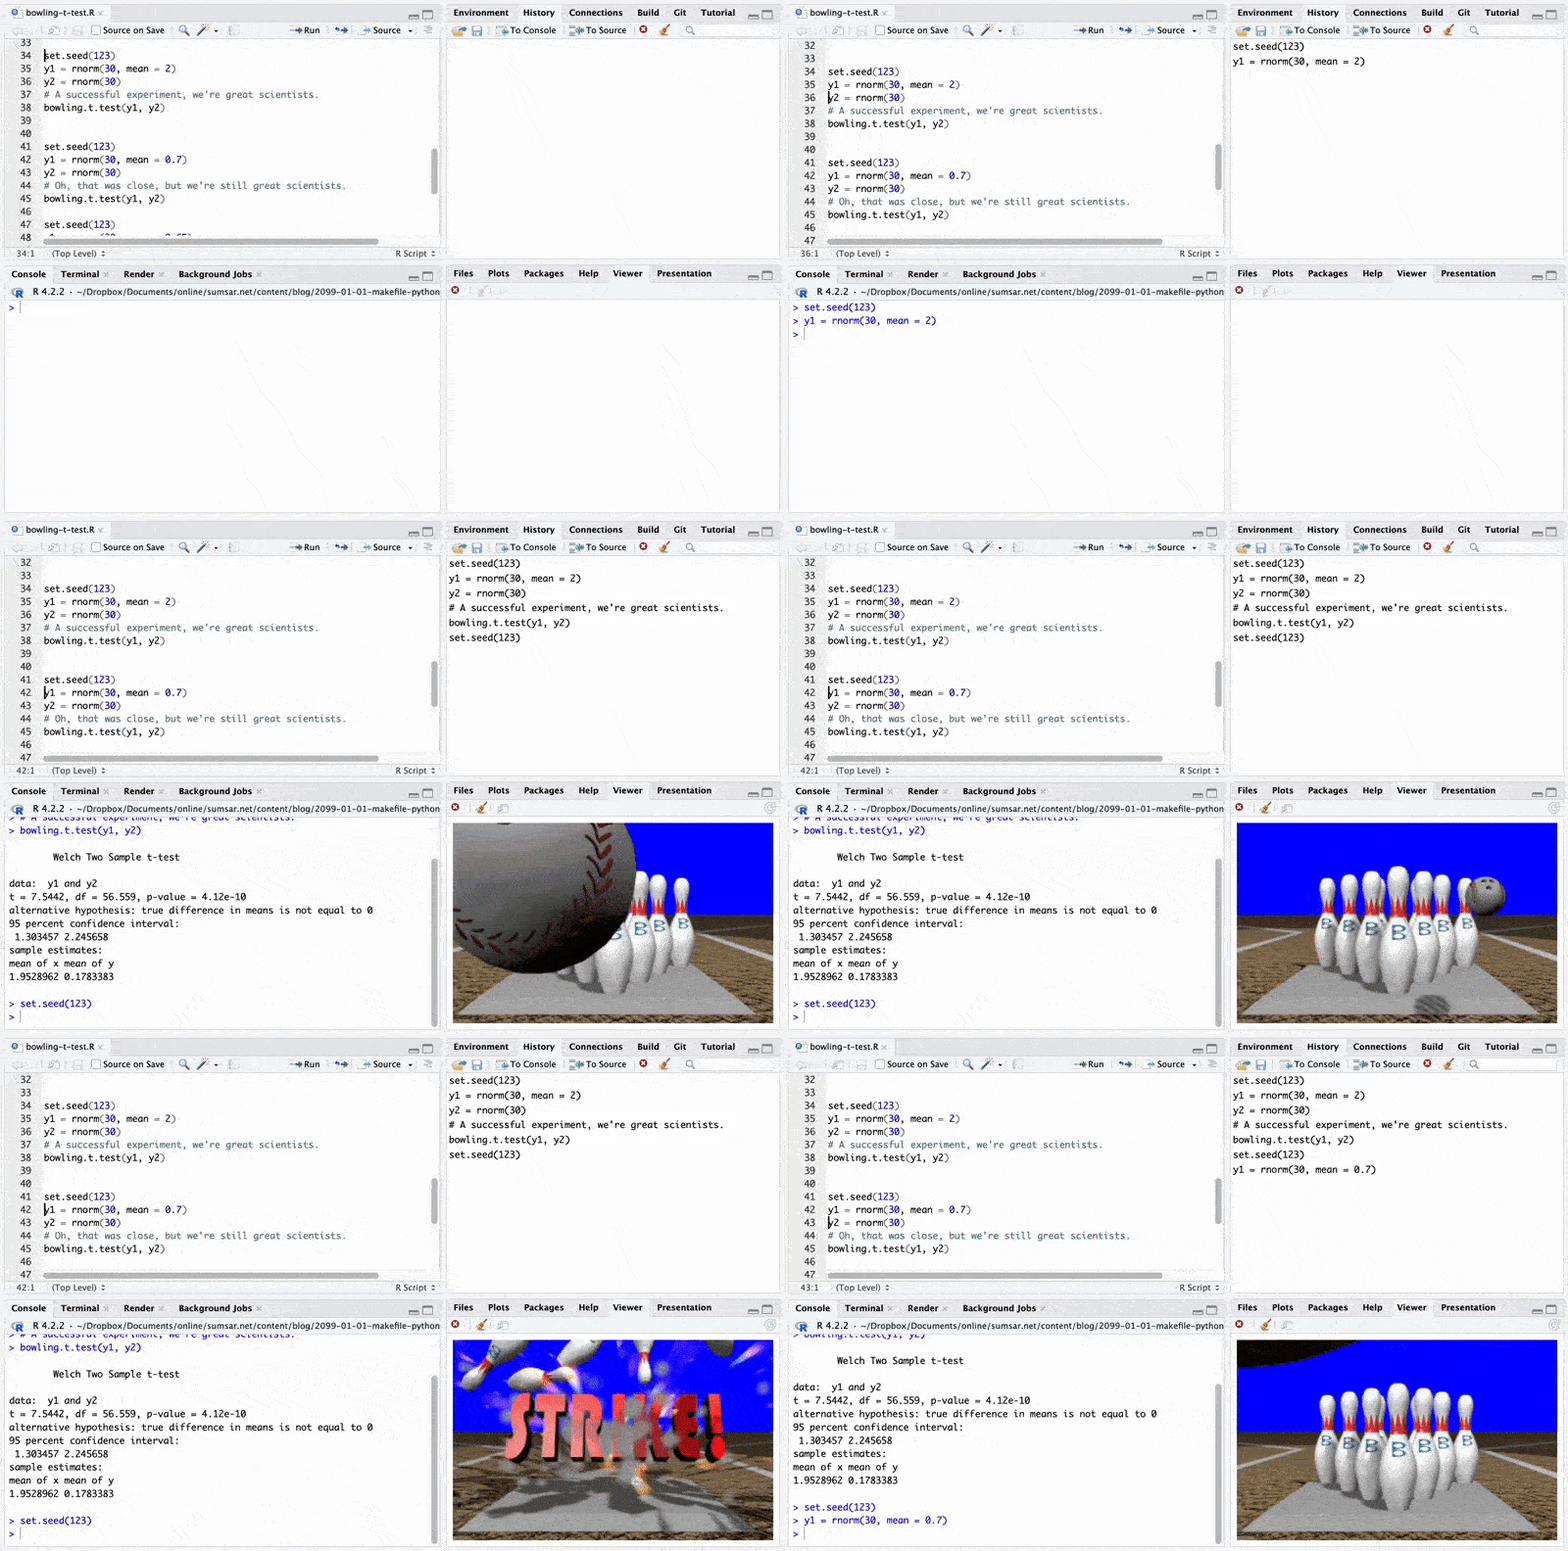
I recently went bowling, and you know those weird 3D-animated bowling animations that all bowling alleys seemed to show whenever you made a strike? They are still alive and well! (At least at my local bowling place). And then I thought: Can I get animations like that into my daily data science workflow? With
Rstudio’s built-in Viewer tab, I absolutely could! Below you find the code for a much improved t.test function that gives you different animations when you hit a strike (), a spare (), a “near miss” () and a complete miss ().

(If you think this is silly, then I agree. Roughly as silly as using ritualized p-value cutoffs to decide whether an experiment is a “success” or not.)
The bowling.t.test function
# The animations we're going to use
# Source: https://archive.org/details/brunswick-frameworx-ten-pin-animations/
bowling_animation_urls <- c(
  "0.01" = "https://i.imgur.com/Kn8CQbj.gif",
  "0.05" = "https://i.imgur.com/HFTKdDL.gif",
  "0.1" = "https://i.imgur.com/8Sw54Mz.gif",
  "1" = "https://i.imgur.com/kjROdhj.gif"
)


bowling_animation_html <- sapply(bowling_animation_urls, function(url) {
  # We need to download the animations to the R session's temp directory
  # to display them in the Rstudio Viewer pane
  animation_path = tempfile(pattern = "bowling_animation", fileext = ".gif")
  download.file(url, animation_path)
  # And we need to create an HTML wrapper around each GIF
  html_path = tempfile(pattern = "bowling_animation", fileext = ".html")
  html <- paste0(
    '<html><body><img src="',
    basename(animation_path) ,
    '" style="width: 100%;height: auto;"/></body></html>'
  )
  writeLines(html, html_path)
  html_path
})

# A much improved t.test function
bowling.t.test <- function(...) {
  test_result <- t.test(...)
  selected_animation_html <- bowling_animation_html[
    test_result$p.value < as.numeric(names(bowling_animation_urls))
  ][1]
  rstudioapi::viewer(selected_animation_html)
  test_result
}
And now trying it out!
set.seed(123)
y1 = rnorm(30, mean = 2)
y2 = rnorm(30)
# A successful experiment, we're great scientists.
bowling.t.test(y1, y2)


  set.seed(123)
y1 = rnorm(30, mean = 0.7)
y2 = rnorm(30)
# Oh, that was close, but we're still great scientists.
bowling.t.test(y1, y2)

set.seed(123)
y1 = rnorm(30, mean = 0.65)
y2 = rnorm(30)
# What bad luck! Let's say it's trending towards significance maybe?
bowling.t.test(y1, y2)


set.seed(123)
y1 = rnorm(30, mean = 0.5)
y2 = rnorm(30)
# What are we even doing with our lives...
bowling.t.test(y1, y2)
Posted by Rasmus Bååth | 2023-02-20 | Tags:
R, Statistics