Hello stranger, and welcome! 👋😊
I'm Rasmus Bååth, data scientist, engineering manager, father, husband, tinkerer,
tweaker, coffee brewer, tea steeper, and, occasionally, publisher of stuff I find
interesting down below👇
Inspired by events that took place at
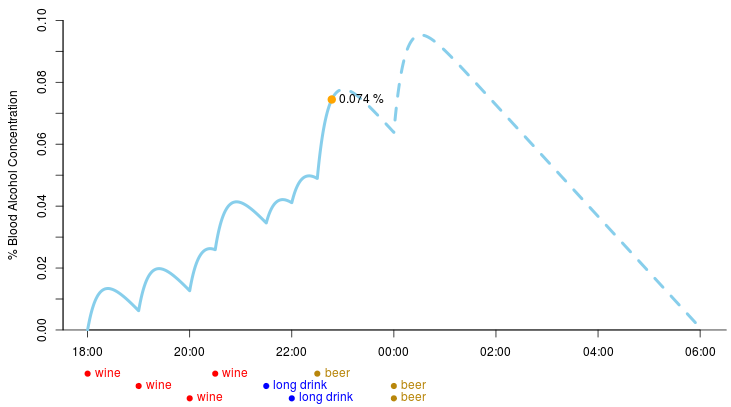
UseR 2014 last month I decided to implement an app that estimates one’s blood alcohol concentration (BAC). Today I present to you
drinkR, implemented using R and
Shiny, Rstudio’s framework for building web apps using R. So, say that I had a good dinner, drinking a couple of glasses of wine, followed by an evening at a divy karaoke bar, drinking a couple of
red needles and a couple of beers. By entering my sex, height and weight and the times when I drank the drinks in the
drinkR app I end up with this estimated BAC curve:
(Now I might be totally off with what drinks I had and when but
Romain Francois,
Karl Broman,
Sandy Griffith,
Karthik Ram and
Hilary Parker can probably fill in the details.) If you want to estimate your current BAC (or a friend’s…) then head over to
the drinkr app hosted at ShinyApps.io. If you want to know how the app estimates BAC read on below.
The code for drinkR is available on GitHub, any suggestion on how it can be improved is greatly appreciated.
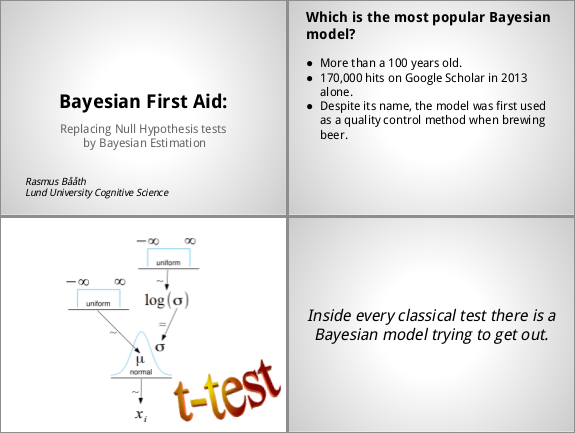
This year’s UseR! conference was held at the University of California in Los Angeles. Despite the great weather and a nearby beach, most of the conference was spent in front of projector screens in 18° c (64° f) rooms because there were so many interesting presentations and tutorials going on. I was lucky to present my R package
Bayesian First Aid and the slides can be found here:
Even though I said it would never happen, my silly package with the sole purpose of playing notification sounds is now on CRAN. Big thanks to the CRAN maintainers for their patience! For instant gratification run the following in R to install beepr and make R produce a notification sound:
install.packages("beepr")
library(beepr)
beep()
Does pill A or pill B save the most lives? Which web design results in the most clicks? Which in vitro fertilization technique results in the largest number of happy babies? A lot of questions out there involves estimating the proportion or relative frequency of success of two or more groups (where success could be a saved life, a click on a link, or a happy baby) and there exists a little known R function that does just that, prop.test. Here I’ll present the Bayesian First Aid version of this procedure. A word of caution, the example data I’ll use is mostly from the
Journal of Human Reproduction and as such it might be slightly NSFW :)

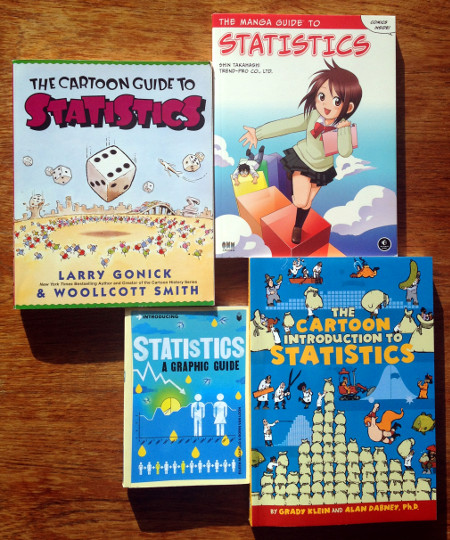
As I’m more or less an autodidact when it comes to statistics, I have a weak spot for books that try to introduce statistics in an accessible and pedagogical way. I have therefore collected what I believe are all books that introduces statistics using comics (at least those written in English). What follows are highly subjective reviews of those four books. If you know of any other comic book on statistics, please do tell me!
I’ll start with a tl;dr version of the reviews, but first here are the four books:
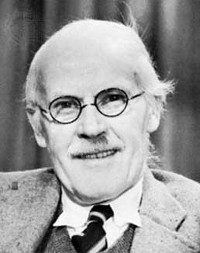
While reading up on quantile regression I found a really nice hack described in
Bayesian Quantile Regression Methods (Lancaster & Jae Jun, 2010). It is called Jeffreys’ substitution posterior for the median, first described by Harold Jeffreys in his Theory of Probability, and is a non-parametric method for approximating the posterior of the median. What makes it cool is that it is really easy to understand and pretty simple to compute, while making no assumptions about the underlying distribution of the data. The method does not strictly produce a posterior distribution, but has been shown to produce a conservative approximation to a valid posterior (Lavine, 1995). In this post I will try to explain Jeffreys’ substitution posterior, give R-code that implements it and finally compare it with a classical non-parametric test, the Wilcoxon signed-rank test. But first a picture of Sir Harold Jeffreys:
Correlation does not imply causation, right but,
as Edward Tufte writes, “it sure is a hint.” The Pearson product-moment correlation coefficient is perhaps one of the most common ways of looking for such hints and this post describes the Bayesian First Aid alternative to the classical Pearson correlation test. Except for being based on Bayesian estimation (a good thing in my book) this alternative is more robust to outliers and comes with a pretty nice default plot. :)
The Matlab syntax for creating matrices is pretty and convenient. Here is a 2x3 matrix in Matlab syntax where , marks a new column and ; marks a new row:
[1, 2, 3;
 4, 5, 6]
Here is how to create the corresponding matrix in R:
matrix(c(1,4,2,5,3,6), 2, 3)
##      [,1] [,2] [,3]
## [1,]    1    2    3
## [2,]    4    5    6
Functional but not as pretty, plus the default is to specify the values column wise. A better solution is to use rbind:
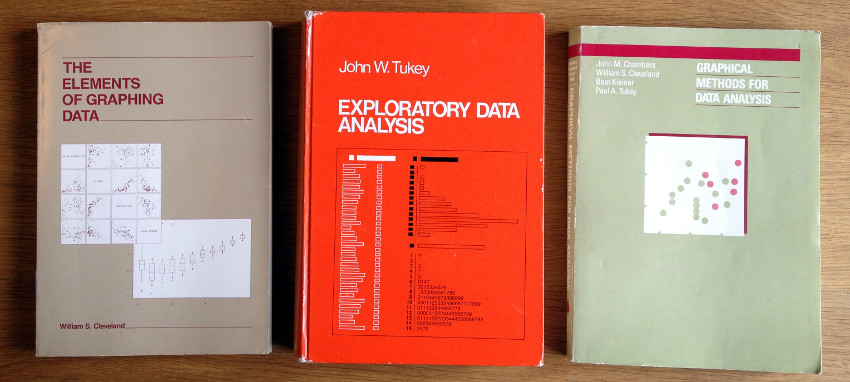
I just wanted to plug for three classical books on statistical graphics that I really enjoyed reading. The books are old (that is, older than me) but still relevant and together they give a sense of the development of exploratory graphics in general and the graphics system in R specifically as all three books were written at Bell Labs where the S-language was developed. What follows is not a review but just me highlighting some things that I liked about these books. So, without further ado, here they are:
As spring follows winter once more here down in southern Sweden, the two sample t-test follows the one sample t-test. This is a continuation of
the Bayesian First Aid alternative to the one sample t-test where I’ll introduce the two sample alternative. It will be a quite short post as the two sample alternative is just more of
the one sample alternative, more of using John K. Kruschke’s
BEST model, and more of the coffee yield data from the 2002 Nature article The Value of Bees to the Coffee Harvest.